Data
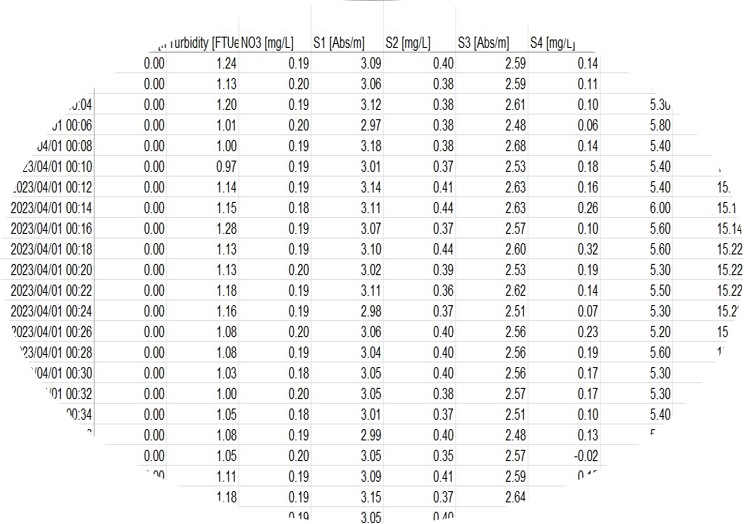
On waterways starting with the Upper Waikato River and tributaries. This will show the level of contaminants in real data with a focus on nitrates, phosphorus, e-coli.
Monitoring stations are currently operating in 8 locations see here with data transmitted back to our central office at DCM Process Control.
The stations build on previous work and data sets and use real time UV/Vis spectrophotometry to provide Waikato Regional Council (WRC) ecologists and ourselves with an increased understanding of the dynamics in Waikato River nutrient concentrations, in particular nitrate, that is not available from (though is supported by) grab sampling records.
The current study is based on a further two years of UV/Vis data from the HCC WTP intake site augmented by data from 6 additional UV/Vis based monitoring stations installed on behalf of Let’s Be Clear Charitable Trust from Feb 2022. These additional stations are positioned between Cambridge Golf Course and the State Highway 1 Waikato River bridge at Wairakei.
The data trends at all sites test the potential to connect upriver events to down river water quality outcomes over large sections of the Upper Waikato River. Such a capability would be expected to result in a better understanding of the Upper Waikato River hydrology. It would also assist in the development of an effective real time model of the health and wellbeing of the river in the context of the 2010 Crown-Waikato Tainui deed of agreement.
Our mission is to extend this coverage using the same methodology to eventually provide this data across Aotearoa New Zealand.

Analysis
What the changes in contaminants mean over time and how flow data impacts the results.
Using the expertise and data modelling algorithms from both Let’s Be Clear and DCM Process Control to explore the data and understand it and to make this understanding available for public viewing so that all of us have a better understanding of the effect on our drinking water, water based activities, as well as effects on business.
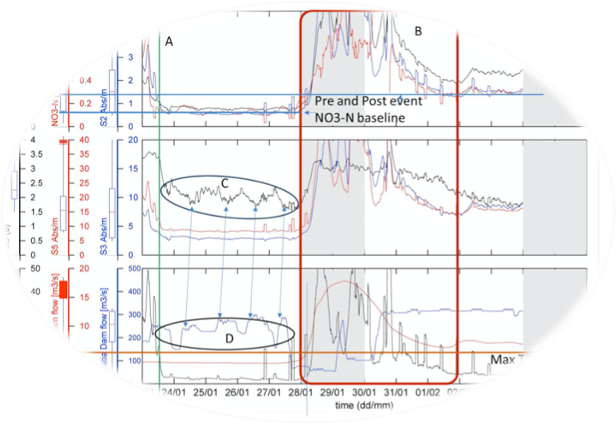
We are looking for the make-up of the compounds present in the water, we are looking for trends and we are looking at time-flows – how an ‘event’ shows itself in the compounds a water travels along the system.
If a weather event leads to a run off of nitrate from fertilisers into a river or tributary, how does that show up, how long does it stay, what impact in terms of bio mass, and what is the effect as it passes through the water system?
This analysis helps us understand the cause and effect and how we can influence both.

Education
What causes the data we are seeing and what can we all do to make a change to a cleaner environment.
Knowledge is power. Sharing this information and knowledge and creating awareness across the community will add a collective effort to protecting our environment. There exist many scientific and journalist articles over many years highlighting the issues. None of those has ensured a continuous public facing data and analysis set that enables an understanding by those in the community who are not scientist or experts.
Our mission is to increase both coverage and contribution across Aotearoa New Zealand. Allowing the community a place to input and share information from their own backyard. Providing a platform of observations, learnings, and actions.

Collaboration
What can our partners in Council, Environmental groups, and Industry teach us and what can we teach them.
Working together for a better outcome. When community works with council, or environmental groups work with industry, solutions or mitigations can be found. We share in a collective vision for Aotearoa New Zealand – we use it in marketing our beautiful country as ‘clean and green’, working together we can prevent further degradation and maybe even reverse some of the negative effects we have had on our water